Barchart.com Weekly What's Hot List
posted by Gordengekko at 12:37 AM
0 comments
![]()
![]()
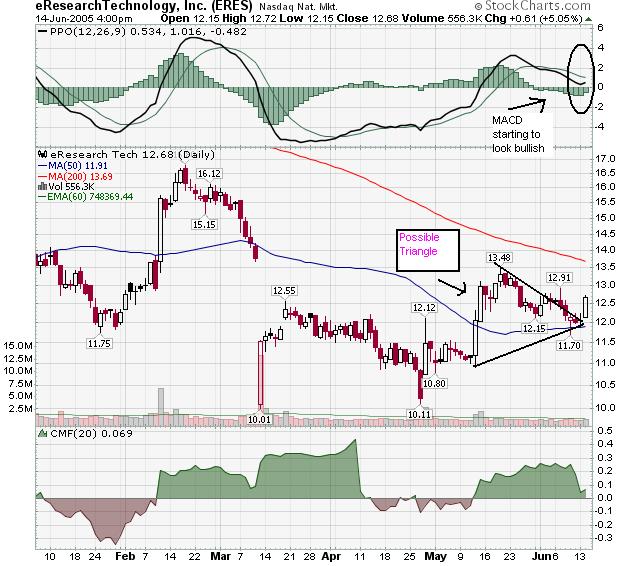
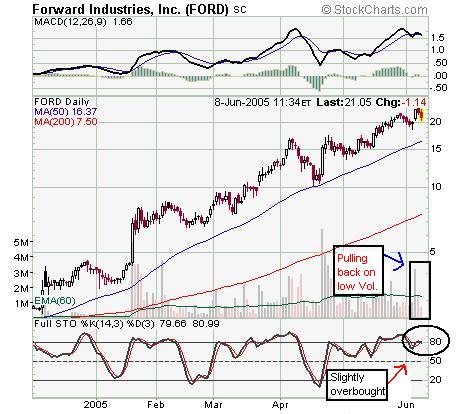
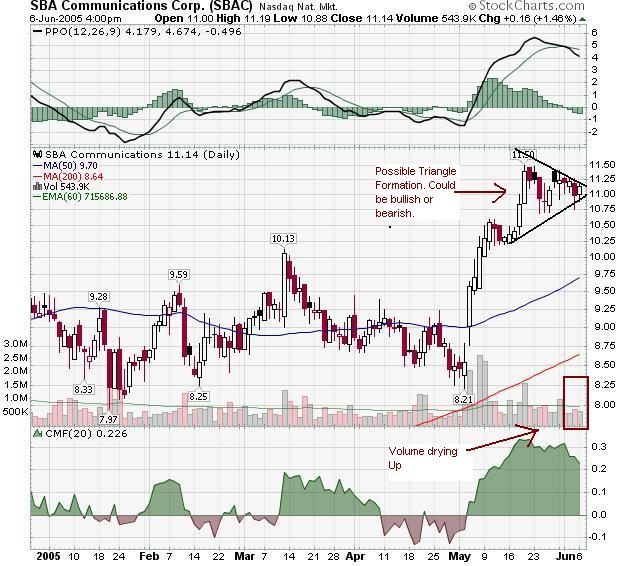
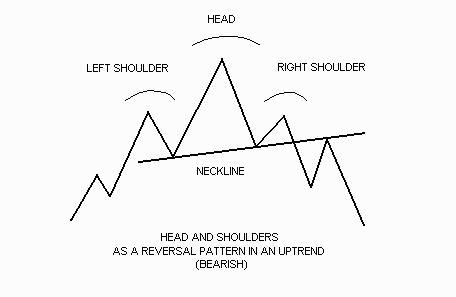
Breakouts and Technical Analysis of Chart Patterns


posted by Gordengekko at 12:23 AM
0 comments
![]()
![]()
posted by Gordengekko at 12:33 AM
0 comments
![]()
![]()
posted by Gordengekko at 3:51 PM
0 comments
![]()
![]()
posted by Gordengekko at 2:25 PM
0 comments
![]()
![]()
posted by Gordengekko at 10:53 PM
0 comments
![]()
![]()
posted by Gordengekko at 1:44 PM
0 comments
![]()
![]()
posted by Gordengekko at 12:33 AM
0 comments
![]()
![]()
posted by Gordengekko at 1:22 PM
0 comments
![]()
![]()

posted by Gordengekko at 10:33 AM
0 comments
![]()
![]()
posted by Gordengekko at 12:46 AM
0 comments
![]()
![]()

posted by Gordengekko at 10:16 PM
0 comments
![]()
![]()